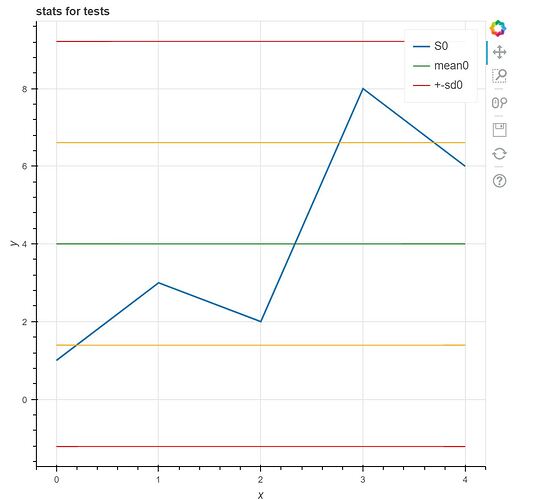
I needed to demonstrate how to track your defect rates (or anything you need) while you’re programming so I cranked out a little hack script that helps you do it. The script is here:
You use it like this:
$ ./stats.py init
$ ./stats.py add tests 1
$ ./stats.py add tests 3
$ ./stats.py add tests 2
$ ./stats.py add tests 8
$ ./stats.py add tests 6
$ ./stats.py stats tests
---
mean    4.0
stddev  2.6076809620810595
sd+/-1  1.3923190379189405, 6.6076809620810595
sd+/-2  -1.215361924162119, 9.215361924162119
q       2.0 3.0 6.0
IQR     4.0
$ ./stats.py graph tests
Which should, in theory, open a browser with a nice run chart of your stat:
This is an html file in .morepytstats/tests.html and you can open it and work with it in the browser. This is all provided by the bokeh project and numpy.
